Monitoring the performance of mission-critical IT systems is important. Being able to spot bottlenecks and potential scalability problems before they start to affect users is extremely valuable to system operators.
IoT systems present their own set of unique challenges which require a multi-faceted monitoring approach.
Because IoT systems generally have a number of moving parts (think listeners, application servers, middleware & adapter layers, databases…) it’s important to have a performance monitoring solution that can take metrics from every part of the system and present them in a simple, consolidated way.
Our Approach
Our MyM2M Web platform supports Flickr’s (and later Etsy’s) Statsd protocol for communicating performance metrics. This means MyM2M Web can be connected to any Statsd-capable metrics aggregator/visualiser.
MyM2M Web sends Statsd information for a wide range of significant events (device connections, config changes, user authentication events, errors) as well as stopwatch metrics for things like request turn-around time.
For a small installation, a tool like Graphite would be perfectly adequate. But because we run MyM2M Web at scale, supporting many thousands of devices across many customers, we needed a metrics aggregation architecture that could keep up.
Aggregation
We use InfluxData’s excellent Telegraf for collection of stats. Essentially, it works by collecting data through a wide range of supported inputs (including Statsd) and then periodically pushing aggegated data into a datastore of your choice.
Telegraf can also run on servers and collect performance metrics (CPU, memory, IO) on Linux systems and on Windows systems via WMI or Windows Performance Counters.
Storage
Our performance metrics are stored by a time series database (TSDB) engine which is excellent at handling the kinds of query we’ll be making against the collected data, compared to a more traditional relational database (RDBMS) such as MySQL. It also supports retention policies to automatically expunge old performance metrics.
Our choice was InfluxData’s InfluxDB. It integrates easily with Telegraf and is supported by quite a few visualisation tools now, so it was a natural choice.
Visualisation
There are a number of tools out there to help you visualise performance metrics. We looked at a number of options before deciding on Grafana.
Grafana supports InfluxDB and a number of other data sources, including AWS CloudWatch Metrics.
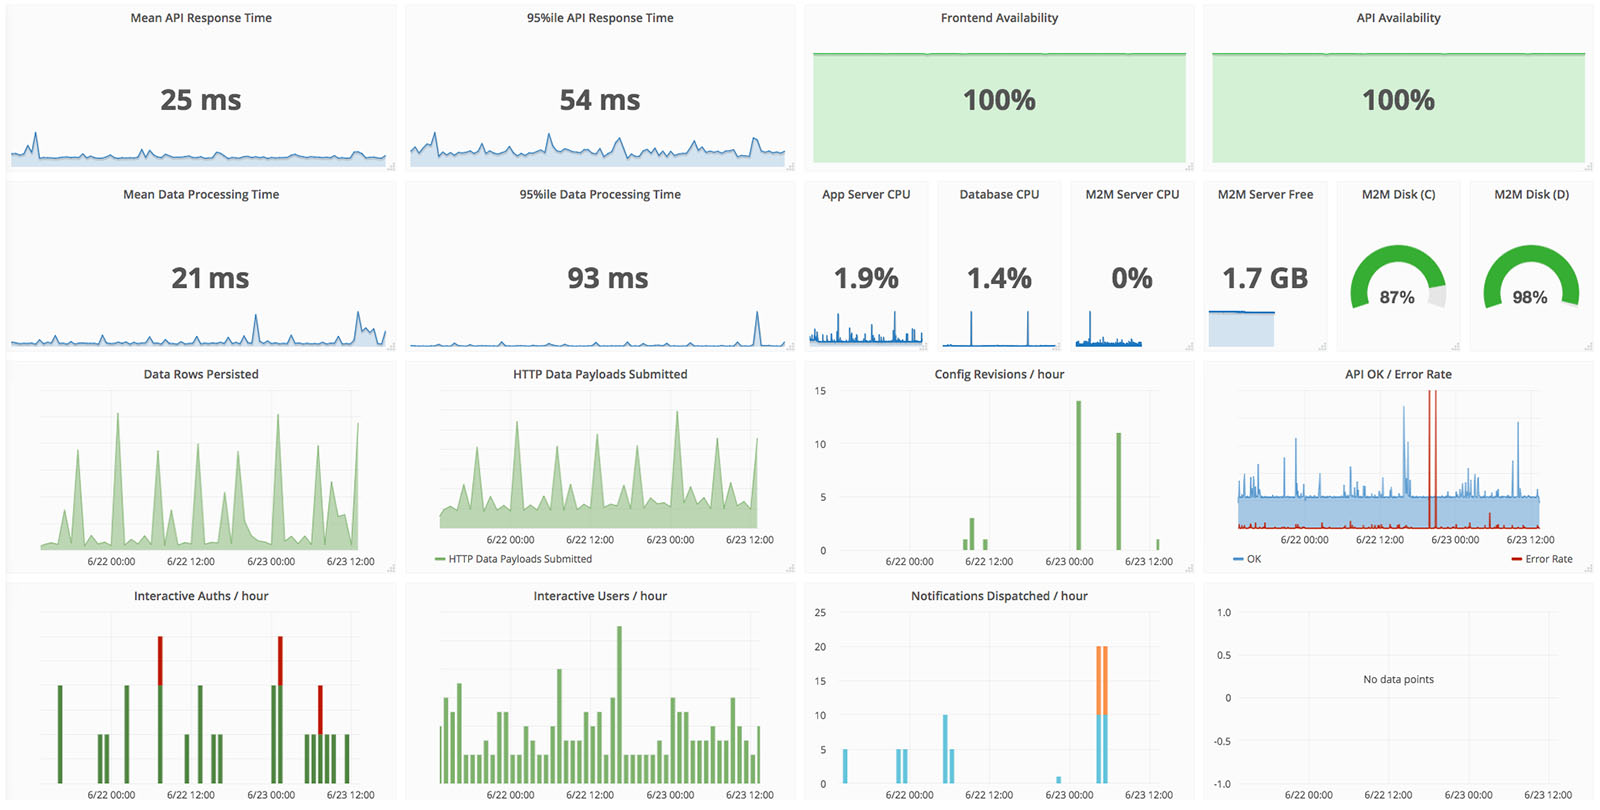
For visualisation, Grafana is incredibly flexible. It allows the creation of dashboards containing charts based on InfluxDB queries which run in real-time. You can also configure thresholds to generate email alerts when metrics go outside desired ranges and much more.
Within days of creating dashboards for our customers, we spotted places in our application stacks where we could make performance improvements or optimisations, so we’d say the time invested in performance monitoring is certainly worth it.
How Can We Help?
We know how complex IoT systems can be and how difficult performance problems can be to track down and resolve.
We’re experts at analysing performance and improving the scalability of IoT/M2M systems. If you think your organisation could benefit from our expertise in this area, or any other, we’d love to help.